Go: Finding Escapes to Heap
Mon, Dec 26, 2022I rarely need to profile the Go code I work on, but when I do I spend most of my time identifying code that is repeatedly pushing values to the heap, or reallocating values on the heap that could be allocated once and reused.
Today I discovered I can get feedback in VSCode from gopls about where
values are escaping to the heap.
Enable the codelens that displays GC annotations by adding the following to your settings.json in VSCode:
"gopls": {
    "codelenses": {
        "gc_details": true,
    },
},
When viewing Go code in VSCode at the top of a file will be a code lens, Toggle gc annotation details. Click it, and you annotations will appear.
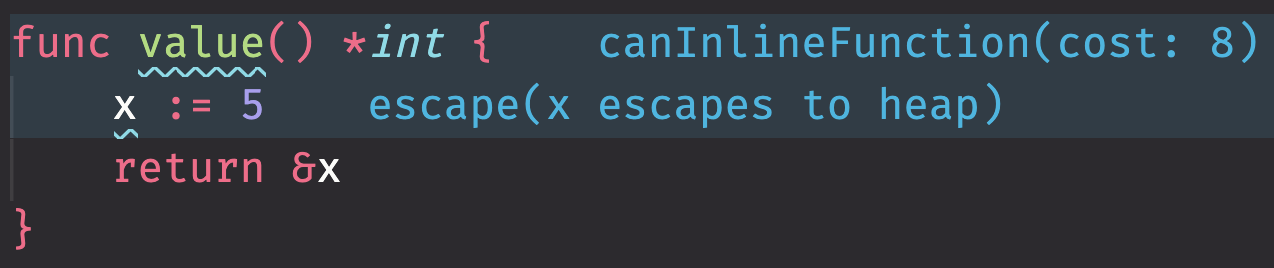
For the code below:
func value() *int {
	x := 5
	return &x
}
You should see something like this:
Using the gc_details codelens doesn’t negate the need to use pprof and
benchmarks to actually profile code, but it does surface straight into the IDE
allocations that are sometimes not obvious to me.
Note: I’m using the VSCode usernamehw.errorlens extensions to display
warnings and hints inline. Your experience might look different depending on the
IDE you’re using, and the extensions installed.