C#: Debugging using Windows Error Reporting
Sun, Sep 23, 2012Debugging a fatal uncatchable exception in a production environment, where we have little information can leave us feeling powerless as a developer. Here I discuss a strategy I used to resolve an uncatchable StackOverflowException.
When an exception is thrown that is either uncaught or uncatchable it is recorded in the Windows Application event log. You can view the event lot by opening the Control Panel -> Administrative Tools -> Event Viewer and selecting the Application log on the left. The exception details are found in an Information level log entry with the source set to Windows Error Reporting.
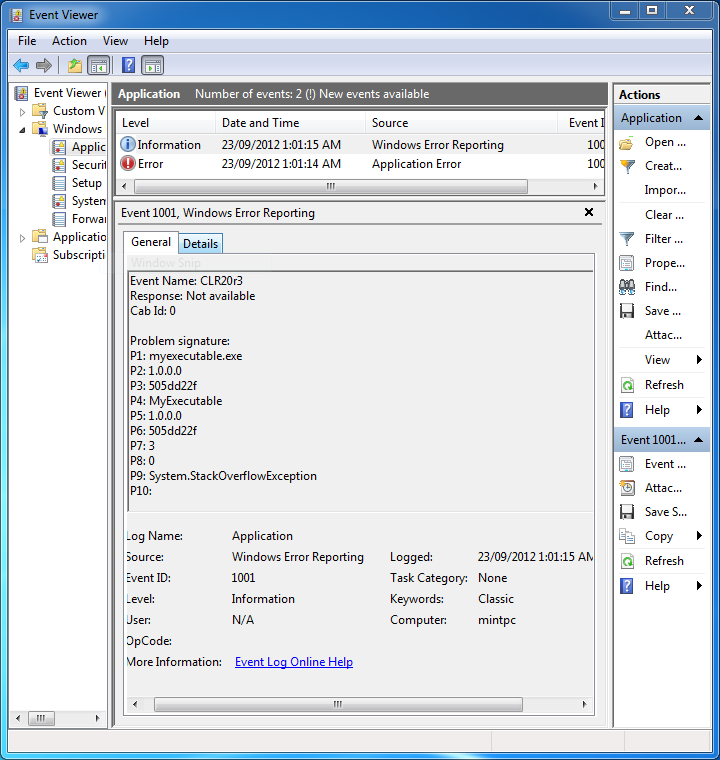
Each of the lines in the problem signature contain useful information (thanks to this post):
P1 = The filename of the executable.
P2 = The assembly version for the executable in P1.
P3 = The assembly timestamp for the executable in P1.
P4 = The assembly where the fault occurred.
P5 = The assembly version for the assembly in P4.
P6 = The assembly timestamp for the assembly in P4.
P7 = The token for the method where the fault occurred.
P8 = The IL offset into the method specified in P7.
P9 = The name of the exception that caused the fault.
There are numerous ways to take the information above and find out where in the offending assembly the fault is occurring. The method I use does not require the application to be running in the debugger and you can use a production release built DLL to find out where the exception has occurred and possibly what caused it.
Open ildasm.exe, which can be found at the path below. If the path is not present you may need to install the Windows 7 SDK. Note the path may not contain (x86) and may have a different version in place of v7.0A.
C:\Program Files (x86)\Microsoft SDKs\Windows\v7.0A\Bin\ildasm.exe
Using the main menu, select File -> Open, and open the DLL/EXE specified in P4. If you have multiple versions of the DLL make sure you get the correct version indicated in P5. In the View menu change the following settings:
- Turn off Sort by Name
- Turn on Show Token Values
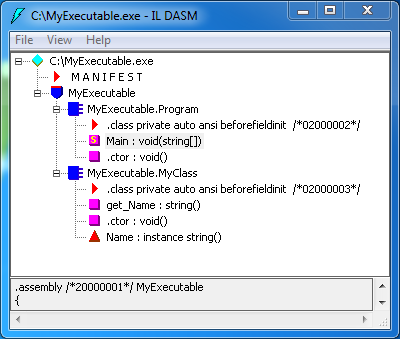
Manually expand each class and double-click on each method. A window will open for each showing a token in the function. The token will follow .method in the format /*06XXXXXX*/. The methods will be sorted by the token; keep looking through them until you find the method with a token where the XXXXXX is the value specified in P7.
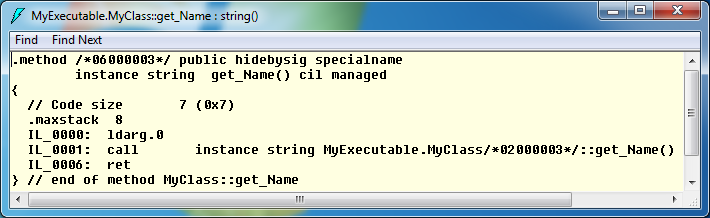
Once you have found the method, look at it’s IL code that is displayed at the beginning of each line in the popup for that method. The instruction that caused the fault will be proceeded by IL_YYYY where YYYY is P8. In the screenshots we can see the method where the exception occurred is MyClass.get_Name() method, which is the get for the Name property. We can also see that the line the exception occurred on was the first instruction.
Using this method we now know where the StackOverflowException occurred, and can look at surrounding code to find the root cause. In our example the overflow is caused by the property returning itself.
The code used in the example is:
// MyClass.cs
namespace MyExecutable
{
    /// <summary>
    /// An example class.
    /// </summary>
    class MyClass
    {
        /// <summary>
        /// The name of the object. Will return itself to demonstrate
        /// unbounded recursion.
        /// </summary>
        public string Name
        {
            get
            {
                return Name;
            }
        }
    }
}
// MyExecutable.cs
namespace MyExecutable
{
/// <summary>
/// The MyExecutable application, which will create an object and print it's name.
/// A StackOverflowException will be thrown when calling obj.Name.
/// </summary>
class Program
{
static void Main(string[] args)
{
MyClass obj = new MyClass();
Console.WriteLine("My object's name is {0}.", obj.Name);
}
}
}